Chart-Plotly
view release on metacpan or search on metacpan
lib/Chart/Plotly/Trace/Violin.pm view on Meta::CPAN
    for my $name ( sort keys %hash ) {
        my $attr = $meta->get_attribute($name);
        if ( defined $attr ) {
            my $value = $hash{$name};
            my $type  = $attr->type_constraint;
            if ( $type && $type->equals('Bool') ) {
                $hash{$name} = $value ? \1 : \0;
            }
        }
    }
    my $plotly_meta = delete $hash{'pmeta'};
    if ( defined $plotly_meta ) {
        $hash{'meta'} = $plotly_meta;
    }
    %hash = ( %hash, %$extra_args );
    delete $hash{'extra_args'};
    if ( $self->can('type') && ( !defined $hash{'type'} ) ) {
        $hash{type} = $self->type();
    }
    return \%hash;
}

sub type {
    my @components = split( /::/, __PACKAGE__ );
    return lc( $components[-1] );
}

has alignmentgroup => (
    is            => "rw",
    isa           => "Str",
    documentation =>
      "Set several traces linked to the same position axis or matching axes to the same alignmentgroup. This controls whether bars compute their positional range dependently or independently.",
);

has bandwidth => (
    is            => "rw",
    isa           => "Num",
    documentation =>
      "Sets the bandwidth used to compute the kernel density estimate. By default, the bandwidth is determined by Silverman's rule of thumb.",
);

has box => ( is  => "rw",
             isa => "Maybe[HashRef]|Chart::Plotly::Trace::Violin::Box", );

has customdata => (
    is            => "rw",
    isa           => "ArrayRef|PDL",
    documentation =>
      "Assigns extra data each datum. This may be useful when listening to hover, click and selection events. Note that, *scatter* traces also appends customdata items in the markers DOM elements",
);

has customdatasrc => ( is            => "rw",
                       isa           => "Str",
                       documentation => "Sets the source reference on Chart Studio Cloud for `customdata`.",
);

has fillcolor => (
    is            => "rw",
    isa           => "Str",
    documentation =>
      "Sets the fill color. Defaults to a half-transparent variant of the line color, marker color, or marker line color, whichever is available.",
);

has hoverinfo => (
    is            => "rw",
    isa           => "Str|ArrayRef[Str]",
    documentation =>
      "Determines which trace information appear on hover. If `none` or `skip` are set, no information is displayed upon hovering. But, if `none` is set, click and hover events are still fired.",
);

has hoverinfosrc => ( is            => "rw",
                      isa           => "Str",
                      documentation => "Sets the source reference on Chart Studio Cloud for `hoverinfo`.",
);

has hoverlabel => ( is  => "rw",
                    isa => "Maybe[HashRef]|Chart::Plotly::Trace::Violin::Hoverlabel", );

has hoveron => (
    is            => "rw",
    isa           => "Str",
    documentation =>
      "Do the hover effects highlight individual violins or sample points or the kernel density estimate or any combination of them?",
);

has hovertemplate => (
    is            => "rw",
    isa           => "Str|ArrayRef[Str]",
    documentation =>
      "Template string used for rendering the information that appear on hover box. Note that this will override `hoverinfo`. Variables are inserted using %{variable}, for example \"y: %{y}\" as well as %{xother}, {%_xother}, {%_xother_}, {%xother_}....
);

has hovertemplatesrc => ( is            => "rw",
                          isa           => "Str",
                          documentation => "Sets the source reference on Chart Studio Cloud for `hovertemplate`.",
);

has hovertext => ( is            => "rw",
                   isa           => "Str|ArrayRef[Str]",
                   documentation => "Same as `text`.",
);

has hovertextsrc => ( is            => "rw",
                      isa           => "Str",
                      documentation => "Sets the source reference on Chart Studio Cloud for `hovertext`.",
);

has ids => (
    is            => "rw",
    isa           => "ArrayRef|PDL",
    documentation =>
      "Assigns id labels to each datum. These ids for object constancy of data points during animation. Should be an array of strings, not numbers or any other type.",
);

has idssrc => ( is            => "rw",
                isa           => "Str",
                documentation => "Sets the source reference on Chart Studio Cloud for `ids`.",
);

has jitter => (
    is            => "rw",
lib/Chart/Plotly/Trace/Violin.pm view on Meta::CPAN
In vertical (horizontal) violin plots, statistics are computed using `y` (`x`) values. By supplying an `x` (`y`) array, one violin per distinct x (y) value is drawn If no `x` (`y`) {array} is provided, a single violin is drawn. That violin position i...
Screenshot of the above example:
=for HTML <p>
<img src="https://raw.githubusercontent.com/pablrod/p5-Chart-Plotly/master/examples/traces/violin.png" alt="Screenshot of the above example">
</p>
=for markdown 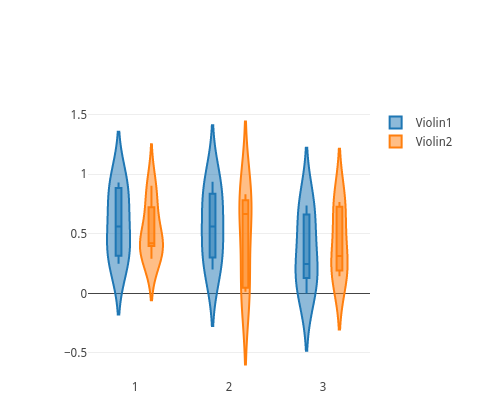
=for HTML <p>
<iframe src="https://raw.githubusercontent.com/pablrod/p5-Chart-Plotly/master/examples/traces/violin.html" style="border:none;" width="80%" height="520"></iframe>
</p>
This file has been autogenerated from the official plotly.js source.
If you like Plotly, please support them: L<https://plot.ly/>
Open source announcement: L<https://plot.ly/javascript/open-source-announcement/>
Full reference: L<https://plot.ly/javascript/reference/#violin>
=head1 DISCLAIMER
This is an unofficial Plotly Perl module. Currently I'm not affiliated in any way with Plotly.
But I think plotly.js is a great library and I want to use it with perl.
=head1 METHODS
=head2 TO_JSON
Serialize the trace to JSON. This method should be called only by L<JSON> serializer.
=head2 type
Trace type.
=head1 ATTRIBUTES
=over
=item * alignmentgroup
Set several traces linked to the same position axis or matching axes to the same alignmentgroup. This controls whether bars compute their positional range dependently or independently.
=item * bandwidth
Sets the bandwidth used to compute the kernel density estimate. By default, the bandwidth is determined by Silverman's rule of thumb.
=item * box
=item * customdata
Assigns extra data each datum. This may be useful when listening to hover, click and selection events. Note that, *scatter* traces also appends customdata items in the markers DOM elements
=item * customdatasrc
Sets the source reference on Chart Studio Cloud for `customdata`.
=item * fillcolor
Sets the fill color. Defaults to a half-transparent variant of the line color, marker color, or marker line color, whichever is available.
=item * hoverinfo
Determines which trace information appear on hover. If `none` or `skip` are set, no information is displayed upon hovering. But, if `none` is set, click and hover events are still fired.
=item * hoverinfosrc
Sets the source reference on Chart Studio Cloud for `hoverinfo`.
=item * hoverlabel
=item * hoveron
Do the hover effects highlight individual violins or sample points or the kernel density estimate or any combination of them?
=item * hovertemplate
Template string used for rendering the information that appear on hover box. Note that this will override `hoverinfo`. Variables are inserted using %{variable}, for example "y: %{y}" as well as %{xother}, {%_xother}, {%_xother_}, {%xother_}. When sho...
=item * hovertemplatesrc
Sets the source reference on Chart Studio Cloud for `hovertemplate`.
=item * hovertext
Same as `text`.
=item * hovertextsrc
Sets the source reference on Chart Studio Cloud for `hovertext`.
=item * ids
Assigns id labels to each datum. These ids for object constancy of data points during animation. Should be an array of strings, not numbers or any other type.
=item * idssrc
Sets the source reference on Chart Studio Cloud for `ids`.
=item * jitter
Sets the amount of jitter in the sample points drawn. If *0*, the sample points align along the distribution axis. If *1*, the sample points are drawn in a random jitter of width equal to the width of the violins.
=item * legendgroup
Sets the legend group for this trace. Traces part of the same legend group hide/show at the same time when toggling legend items.
=item * legendgrouptitle
=item * legendrank
Sets the legend rank for this trace. Items and groups with smaller ranks are presented on top/left side while with `*reversed* `legend.traceorder` they are on bottom/right side. The default legendrank is 1000, so that you can use ranks less than 1000...
=item * line
=item * marker
=item * meanline
=item * pmeta
( run in 0.535 second using v1.01-cache-2.11-cpan-7fcb06a456a )