Chart-Plotly
view release on metacpan or search on metacpan
lib/Chart/Plotly/Trace/Scattermapbox.pm view on Meta::CPAN
            my $type  = $attr->type_constraint;
            if ( $type && $type->equals('Bool') ) {
                $hash{$name} = $value ? \1 : \0;
            }
        }
    }
    my $plotly_meta = delete $hash{'pmeta'};
    if ( defined $plotly_meta ) {
        $hash{'meta'} = $plotly_meta;
    }
    %hash = ( %hash, %$extra_args );
    delete $hash{'extra_args'};
    if ( $self->can('type') && ( !defined $hash{'type'} ) ) {
        $hash{type} = $self->type();
    }
    return \%hash;
}

sub type {
    my @components = split( /::/, __PACKAGE__ );
    return lc( $components[-1] );
}

has below => (
    is            => "rw",
    isa           => "Str",
    documentation =>
      "Determines if this scattermapbox trace's layers are to be inserted before the layer with the specified ID. By default, scattermapbox layers are inserted above all the base layers. To place the scattermapbox layers above every other layer, set ...
);

has connectgaps => (
           is            => "rw",
           isa           => "Bool",
           documentation =>
             "Determines whether or not gaps (i.e. {nan} or missing values) in the provided data arrays are connected.",
);

has customdata => (
    is            => "rw",
    isa           => "ArrayRef|PDL",
    documentation =>
      "Assigns extra data each datum. This may be useful when listening to hover, click and selection events. Note that, *scatter* traces also appends customdata items in the markers DOM elements",
);

has customdatasrc => ( is            => "rw",
                       isa           => "Str",
                       documentation => "Sets the source reference on Chart Studio Cloud for `customdata`.",
);

has fill => (
    is            => "rw",
    isa           => enum( [ "none", "toself" ] ),
    documentation =>
      "Sets the area to fill with a solid color. Use with `fillcolor` if not *none*. *toself* connects the endpoints of the trace (or each segment of the trace if it has gaps) into a closed shape.",
);

has fillcolor => (
    is            => "rw",
    isa           => "Str",
    documentation =>
      "Sets the fill color. Defaults to a half-transparent variant of the line color, marker color, or marker line color, whichever is available.",
);

has hoverinfo => (
    is            => "rw",
    isa           => "Str|ArrayRef[Str]",
    documentation =>
      "Determines which trace information appear on hover. If `none` or `skip` are set, no information is displayed upon hovering. But, if `none` is set, click and hover events are still fired.",
);

has hoverinfosrc => ( is            => "rw",
                      isa           => "Str",
                      documentation => "Sets the source reference on Chart Studio Cloud for `hoverinfo`.",
);

has hoverlabel => ( is  => "rw",
                    isa => "Maybe[HashRef]|Chart::Plotly::Trace::Scattermapbox::Hoverlabel", );

has hovertemplate => (
    is            => "rw",
    isa           => "Str|ArrayRef[Str]",
    documentation =>
      "Template string used for rendering the information that appear on hover box. Note that this will override `hoverinfo`. Variables are inserted using %{variable}, for example \"y: %{y}\" as well as %{xother}, {%_xother}, {%_xother_}, {%xother_}....
);

has hovertemplatesrc => ( is            => "rw",
                          isa           => "Str",
                          documentation => "Sets the source reference on Chart Studio Cloud for `hovertemplate`.",
);

has hovertext => (
    is            => "rw",
    isa           => "Str|ArrayRef[Str]",
    documentation =>
      "Sets hover text elements associated with each (lon,lat) pair If a single string, the same string appears over all the data points. If an array of string, the items are mapped in order to the this trace's (lon,lat) coordinates. To be seen, trac...
);

has hovertextsrc => ( is            => "rw",
                      isa           => "Str",
                      documentation => "Sets the source reference on Chart Studio Cloud for `hovertext`.",
);

has ids => (
    is            => "rw",
    isa           => "ArrayRef|PDL",
    documentation =>
      "Assigns id labels to each datum. These ids for object constancy of data points during animation. Should be an array of strings, not numbers or any other type.",
);

has idssrc => ( is            => "rw",
                isa           => "Str",
                documentation => "Sets the source reference on Chart Studio Cloud for `ids`.",
);

has lat => ( is            => "rw",
             isa           => "ArrayRef|PDL",
             documentation => "Sets the latitude coordinates (in degrees North).",
);

has latsrc => ( is            => "rw",
                isa           => "Str",
lib/Chart/Plotly/Trace/Scattermapbox.pm view on Meta::CPAN
Screenshot of the above example:
=for HTML <p>
<img src="https://raw.githubusercontent.com/pablrod/p5-Chart-Plotly/master/examples/traces/scattermapbox.png" alt="Screenshot of the above example">
</p>
=for markdown 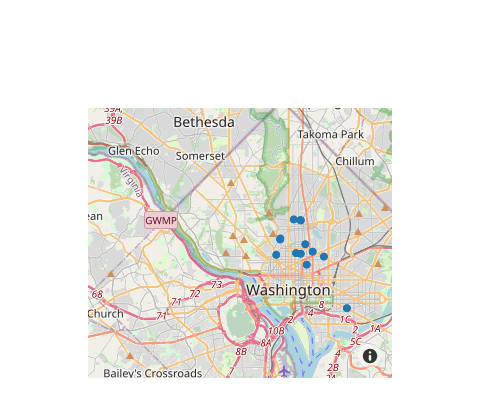
=for HTML <p>
<iframe src="https://raw.githubusercontent.com/pablrod/p5-Chart-Plotly/master/examples/traces/scattermapbox.html" style="border:none;" width="80%" height="520"></iframe>
</p>
This file has been autogenerated from the official plotly.js source.
If you like Plotly, please support them: L<https://plot.ly/>
Open source announcement: L<https://plot.ly/javascript/open-source-announcement/>
Full reference: L<https://plot.ly/javascript/reference/#scattermapbox>
=head1 DISCLAIMER
This is an unofficial Plotly Perl module. Currently I'm not affiliated in any way with Plotly.
But I think plotly.js is a great library and I want to use it with perl.
=head1 METHODS
=head2 TO_JSON
Serialize the trace to JSON. This method should be called only by L<JSON> serializer.
=head2 type
Trace type.
=head1 ATTRIBUTES
=over
=item * below
Determines if this scattermapbox trace's layers are to be inserted before the layer with the specified ID. By default, scattermapbox layers are inserted above all the base layers. To place the scattermapbox layers above every other layer, set `below`...
=item * connectgaps
Determines whether or not gaps (i.e. {nan} or missing values) in the provided data arrays are connected.
=item * customdata
Assigns extra data each datum. This may be useful when listening to hover, click and selection events. Note that, *scatter* traces also appends customdata items in the markers DOM elements
=item * customdatasrc
Sets the source reference on Chart Studio Cloud for `customdata`.
=item * fill
Sets the area to fill with a solid color. Use with `fillcolor` if not *none*. *toself* connects the endpoints of the trace (or each segment of the trace if it has gaps) into a closed shape.
=item * fillcolor
Sets the fill color. Defaults to a half-transparent variant of the line color, marker color, or marker line color, whichever is available.
=item * hoverinfo
Determines which trace information appear on hover. If `none` or `skip` are set, no information is displayed upon hovering. But, if `none` is set, click and hover events are still fired.
=item * hoverinfosrc
Sets the source reference on Chart Studio Cloud for `hoverinfo`.
=item * hoverlabel
=item * hovertemplate
Template string used for rendering the information that appear on hover box. Note that this will override `hoverinfo`. Variables are inserted using %{variable}, for example "y: %{y}" as well as %{xother}, {%_xother}, {%_xother_}, {%xother_}. When sho...
=item * hovertemplatesrc
Sets the source reference on Chart Studio Cloud for `hovertemplate`.
=item * hovertext
Sets hover text elements associated with each (lon,lat) pair If a single string, the same string appears over all the data points. If an array of string, the items are mapped in order to the this trace's (lon,lat) coordinates. To be seen, trace `hove...
=item * hovertextsrc
Sets the source reference on Chart Studio Cloud for `hovertext`.
=item * ids
Assigns id labels to each datum. These ids for object constancy of data points during animation. Should be an array of strings, not numbers or any other type.
=item * idssrc
Sets the source reference on Chart Studio Cloud for `ids`.
=item * lat
Sets the latitude coordinates (in degrees North).
=item * latsrc
Sets the source reference on Chart Studio Cloud for `lat`.
=item * legendgroup
Sets the legend group for this trace. Traces part of the same legend group hide/show at the same time when toggling legend items.
=item * legendgrouptitle
=item * legendrank
Sets the legend rank for this trace. Items and groups with smaller ranks are presented on top/left side while with `*reversed* `legend.traceorder` they are on bottom/right side. The default legendrank is 1000, so that you can use ranks less than 1000...
=item * line
=item * lon
Sets the longitude coordinates (in degrees East).
=item * lonsrc
( run in 2.052 seconds using v1.01-cache-2.11-cpan-7fcb06a456a )