Chart-Plotly
view release on metacpan or search on metacpan
lib/Chart/Plotly/Trace/Mesh3d.pm view on Meta::CPAN
has showscale => ( is => "rw",
isa => "Bool",
documentation => "Determines whether or not a colorbar is displayed for this trace.",
);
has stream => ( is => "rw",
isa => "Maybe[HashRef]|Chart::Plotly::Trace::Mesh3d::Stream", );
has text => (
is => "rw",
isa => "Str|ArrayRef[Str]",
documentation =>
"Sets the text elements associated with the vertices. If trace `hoverinfo` contains a *text* flag and *hovertext* is not set, these elements will be seen in the hover labels.",
);
has textsrc => ( is => "rw",
isa => "Str",
documentation => "Sets the source reference on Chart Studio Cloud for `text`.",
);
has uid => (
is => "rw",
isa => "Str",
documentation =>
"Assign an id to this trace, Use this to provide object constancy between traces during animations and transitions.",
);
has uirevision => (
is => "rw",
isa => "Any",
documentation =>
"Controls persistence of some user-driven changes to the trace: `constraintrange` in `parcoords` traces, as well as some `editable: true` modifications such as `name` and `colorbar.title`. Defaults to `layout.uirevision`. Note that other user-d...
);
has vertexcolor => (
is => "rw",
isa => "ArrayRef|PDL",
documentation =>
"Sets the color of each vertex Overrides *color*. While Red, green and blue colors are in the range of 0 and 255; in the case of having vertex color data in RGBA format, the alpha color should be normalized to be between 0 and 1.",
);
has vertexcolorsrc => ( is => "rw",
isa => "Str",
documentation => "Sets the source reference on Chart Studio Cloud for `vertexcolor`.",
);
has visible => (
is => "rw",
documentation =>
"Determines whether or not this trace is visible. If *legendonly*, the trace is not drawn, but can appear as a legend item (provided that the legend itself is visible).",
);
has x => (
is => "rw",
isa => "ArrayRef|PDL",
documentation =>
"Sets the X coordinates of the vertices. The nth element of vectors `x`, `y` and `z` jointly represent the X, Y and Z coordinates of the nth vertex.",
);
has xcalendar => ( is => "rw",
isa => enum(
[ "chinese", "coptic", "discworld", "ethiopian", "gregorian", "hebrew", "islamic", "jalali",
"julian", "mayan", "nanakshahi", "nepali", "persian", "taiwan", "thai", "ummalqura"
]
),
documentation => "Sets the calendar system to use with `x` date data.",
);
has xhoverformat => (
is => "rw",
isa => "Str",
documentation =>
"Sets the hover text formatting rulefor `x` using d3 formatting mini-languages which are very similar to those in Python. For numbers, see: https://github.com/d3/d3-format/tree/v1.4.5#d3-format. And for dates see: https://github.com/d3/d3-time...
);
has xsrc => ( is => "rw",
isa => "Str",
documentation => "Sets the source reference on Chart Studio Cloud for `x`.",
);
has y => (
is => "rw",
isa => "ArrayRef|PDL",
documentation =>
"Sets the Y coordinates of the vertices. The nth element of vectors `x`, `y` and `z` jointly represent the X, Y and Z coordinates of the nth vertex.",
);
has ycalendar => ( is => "rw",
isa => enum(
[ "chinese", "coptic", "discworld", "ethiopian", "gregorian", "hebrew", "islamic", "jalali",
"julian", "mayan", "nanakshahi", "nepali", "persian", "taiwan", "thai", "ummalqura"
]
),
documentation => "Sets the calendar system to use with `y` date data.",
);
has yhoverformat => (
is => "rw",
isa => "Str",
documentation =>
"Sets the hover text formatting rulefor `y` using d3 formatting mini-languages which are very similar to those in Python. For numbers, see: https://github.com/d3/d3-format/tree/v1.4.5#d3-format. And for dates see: https://github.com/d3/d3-time...
);
has ysrc => ( is => "rw",
isa => "Str",
documentation => "Sets the source reference on Chart Studio Cloud for `y`.",
);
has z => (
is => "rw",
isa => "ArrayRef|PDL",
documentation =>
"Sets the Z coordinates of the vertices. The nth element of vectors `x`, `y` and `z` jointly represent the X, Y and Z coordinates of the nth vertex.",
);
has zcalendar => ( is => "rw",
isa => enum(
[ "chinese", "coptic", "discworld", "ethiopian", "gregorian", "hebrew", "islamic", "jalali",
"julian", "mayan", "nanakshahi", "nepali", "persian", "taiwan", "thai", "ummalqura"
]
),
documentation => "Sets the calendar system to use with `z` date data.",
);
has zhoverformat => (
is => "rw",
isa => "Str",
documentation =>
"Sets the hover text formatting rulefor `z` using d3 formatting mini-languages which are very similar to those in Python. For numbers, see: https://github.com/d3/d3-format/tree/v1.4.5#d3-format. And for dates see: https://github.com/d3/d3-time...
);
has zsrc => ( is => "rw",
isa => "Str",
documentation => "Sets the source reference on Chart Studio Cloud for `z`.",
);
__PACKAGE__->meta->make_immutable();
1;
__END__
=pod
=encoding utf-8
=head1 NAME
Chart::Plotly::Trace::Mesh3d - Draws sets of triangles with coordinates given by three 1-dimensional arrays in `x`, `y`, `z` and (1) a sets of `i`, `j`, `k` indices (2) Delaunay triangulation or (3) the Alpha-shape algorithm or (4) the Convex-hull al...
=head1 VERSION
version 0.042
=head1 SYNOPSIS
use Chart::Plotly qw(show_plot);
use Chart::Plotly::Trace::Mesh3d;
use List::Flatten;
use List::MoreUtils qw/pairwise/;
use English qw(-no_match_vars);
my @x = flat map { [ 0 .. 10 ] } ( 0 .. 10 );
my @y = flat map {
my $y = $ARG;
map { $y } ( 0 .. 10 )
} ( 0 .. 10 );
my @z = pairwise { $a * $a + $b * $b } @x, @y;
my $mesh3d = Chart::Plotly::Trace::Mesh3d->new( x => \@x, y => \@y, z => \@z );
show_plot( [$mesh3d] );
=head1 DESCRIPTION
Draws sets of triangles with coordinates given by three 1-dimensional arrays in `x`, `y`, `z` and (1) a sets of `i`, `j`, `k` indices (2) Delaunay triangulation or (3) the Alpha-shape algorithm or (4) the Convex-hull algorithm
Screenshot of the above example:
=for HTML <p>
<img src="https://raw.githubusercontent.com/pablrod/p5-Chart-Plotly/master/examples/traces/mesh3d.png" alt="Screenshot of the above example">
</p>
=for markdown 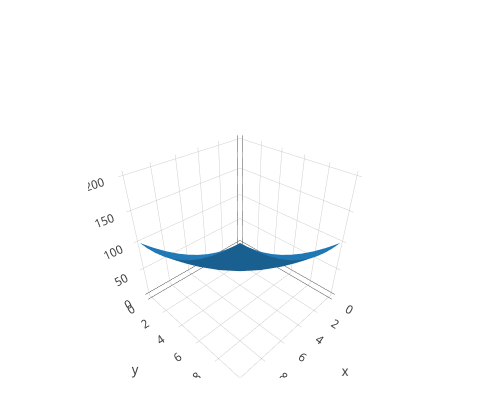
lib/Chart/Plotly/Trace/Mesh3d.pm view on Meta::CPAN
Sets the source reference on Chart Studio Cloud for `meta`.
=item * name
Sets the trace name. The trace name appear as the legend item and on hover.
=item * opacity
Sets the opacity of the surface. Please note that in the case of using high `opacity` values for example a value greater than or equal to 0.5 on two surfaces (and 0.25 with four surfaces), an overlay of multiple transparent surfaces may not perfectly...
=item * reversescale
Reverses the color mapping if true. If true, `cmin` will correspond to the last color in the array and `cmax` will correspond to the first color.
=item * scene
Sets a reference between this trace's 3D coordinate system and a 3D scene. If *scene* (the default value), the (x,y,z) coordinates refer to `layout.scene`. If *scene2*, the (x,y,z) coordinates refer to `layout.scene2`, and so on.
=item * showlegend
Determines whether or not an item corresponding to this trace is shown in the legend.
=item * showscale
Determines whether or not a colorbar is displayed for this trace.
=item * stream
=item * text
Sets the text elements associated with the vertices. If trace `hoverinfo` contains a *text* flag and *hovertext* is not set, these elements will be seen in the hover labels.
=item * textsrc
Sets the source reference on Chart Studio Cloud for `text`.
=item * uid
Assign an id to this trace, Use this to provide object constancy between traces during animations and transitions.
=item * uirevision
Controls persistence of some user-driven changes to the trace: `constraintrange` in `parcoords` traces, as well as some `editable: true` modifications such as `name` and `colorbar.title`. Defaults to `layout.uirevision`. Note that other user-driven t...
=item * vertexcolor
Sets the color of each vertex Overrides *color*. While Red, green and blue colors are in the range of 0 and 255; in the case of having vertex color data in RGBA format, the alpha color should be normalized to be between 0 and 1.
=item * vertexcolorsrc
Sets the source reference on Chart Studio Cloud for `vertexcolor`.
=item * visible
Determines whether or not this trace is visible. If *legendonly*, the trace is not drawn, but can appear as a legend item (provided that the legend itself is visible).
=item * x
Sets the X coordinates of the vertices. The nth element of vectors `x`, `y` and `z` jointly represent the X, Y and Z coordinates of the nth vertex.
=item * xcalendar
Sets the calendar system to use with `x` date data.
=item * xhoverformat
Sets the hover text formatting rulefor `x` using d3 formatting mini-languages which are very similar to those in Python. For numbers, see: https://github.com/d3/d3-format/tree/v1.4.5#d3-format. And for dates see: https://github.com/d3/d3-time-format...
=item * xsrc
Sets the source reference on Chart Studio Cloud for `x`.
=item * y
Sets the Y coordinates of the vertices. The nth element of vectors `x`, `y` and `z` jointly represent the X, Y and Z coordinates of the nth vertex.
=item * ycalendar
Sets the calendar system to use with `y` date data.
=item * yhoverformat
Sets the hover text formatting rulefor `y` using d3 formatting mini-languages which are very similar to those in Python. For numbers, see: https://github.com/d3/d3-format/tree/v1.4.5#d3-format. And for dates see: https://github.com/d3/d3-time-format...
=item * ysrc
Sets the source reference on Chart Studio Cloud for `y`.
=item * z
Sets the Z coordinates of the vertices. The nth element of vectors `x`, `y` and `z` jointly represent the X, Y and Z coordinates of the nth vertex.
=item * zcalendar
Sets the calendar system to use with `z` date data.
=item * zhoverformat
Sets the hover text formatting rulefor `z` using d3 formatting mini-languages which are very similar to those in Python. For numbers, see: https://github.com/d3/d3-format/tree/v1.4.5#d3-format. And for dates see: https://github.com/d3/d3-time-format...
=item * zsrc
Sets the source reference on Chart Studio Cloud for `z`.
=back
=head1 AUTHOR
Pablo RodrÃguez González <pablo.rodriguez.gonzalez@gmail.com>
=head1 COPYRIGHT AND LICENSE
This software is Copyright (c) 2022 by Pablo RodrÃguez González.
This is free software, licensed under:
The MIT (X11) License
=cut
( run in 0.834 second using v1.01-cache-2.11-cpan-f52f0507bed )