Chart-Plotly
view release on metacpan or search on metacpan
lib/Chart/Plotly/Trace/Icicle.pm view on Meta::CPAN
    delete $hash{'extra_args'};
    if ( $self->can('type') && ( !defined $hash{'type'} ) ) {
        $hash{type} = $self->type();
    }
    return \%hash;
}

sub type {
    my @components = split( /::/, __PACKAGE__ );
    return lc( $components[-1] );
}

has branchvalues => (
    is            => "rw",
    isa           => enum( [ "remainder", "total" ] ),
    documentation =>
      "Determines how the items in `values` are summed. When set to *total*, items in `values` are taken to be value of all its descendants. When set to *remainder*, items in `values` corresponding to the root and the branches sectors are taken to be...
);

has count => (
    is            => "rw",
    isa           => "Str",
    documentation =>
      "Determines default for `values` when it is not provided, by inferring a 1 for each of the *leaves* and/or *branches*, otherwise 0.",
);

has customdata => (
    is            => "rw",
    isa           => "ArrayRef|PDL",
    documentation =>
      "Assigns extra data each datum. This may be useful when listening to hover, click and selection events. Note that, *scatter* traces also appends customdata items in the markers DOM elements",
);

has customdatasrc => ( is            => "rw",
                       isa           => "Str",
                       documentation => "Sets the source reference on Chart Studio Cloud for `customdata`.",
);

has domain => ( is  => "rw",
                isa => "Maybe[HashRef]|Chart::Plotly::Trace::Icicle::Domain", );

has hoverinfo => (
    is            => "rw",
    isa           => "Str|ArrayRef[Str]",
    documentation =>
      "Determines which trace information appear on hover. If `none` or `skip` are set, no information is displayed upon hovering. But, if `none` is set, click and hover events are still fired.",
);

has hoverinfosrc => ( is            => "rw",
                      isa           => "Str",
                      documentation => "Sets the source reference on Chart Studio Cloud for `hoverinfo`.",
);

has hoverlabel => ( is  => "rw",
                    isa => "Maybe[HashRef]|Chart::Plotly::Trace::Icicle::Hoverlabel", );

has hovertemplate => (
    is            => "rw",
    isa           => "Str|ArrayRef[Str]",
    documentation =>
      "Template string used for rendering the information that appear on hover box. Note that this will override `hoverinfo`. Variables are inserted using %{variable}, for example \"y: %{y}\" as well as %{xother}, {%_xother}, {%_xother_}, {%xother_}....
);

has hovertemplatesrc => ( is            => "rw",
                          isa           => "Str",
                          documentation => "Sets the source reference on Chart Studio Cloud for `hovertemplate`.",
);

has hovertext => (
    is            => "rw",
    isa           => "Str|ArrayRef[Str]",
    documentation =>
      "Sets hover text elements associated with each sector. If a single string, the same string appears for all data points. If an array of string, the items are mapped in order of this trace's sectors. To be seen, trace `hoverinfo` must contain a *...
);

has hovertextsrc => ( is            => "rw",
                      isa           => "Str",
                      documentation => "Sets the source reference on Chart Studio Cloud for `hovertext`.",
);

has ids => (
    is            => "rw",
    isa           => "ArrayRef|PDL",
    documentation =>
      "Assigns id labels to each datum. These ids for object constancy of data points during animation. Should be an array of strings, not numbers or any other type.",
);

has idssrc => ( is            => "rw",
                isa           => "Str",
                documentation => "Sets the source reference on Chart Studio Cloud for `ids`.",
);

has insidetextfont => ( is  => "rw",
                        isa => "Maybe[HashRef]|Chart::Plotly::Trace::Icicle::Insidetextfont", );

has labels => ( is            => "rw",
                isa           => "ArrayRef|PDL",
                documentation => "Sets the labels of each of the sectors.",
);

has labelssrc => ( is            => "rw",
                   isa           => "Str",
                   documentation => "Sets the source reference on Chart Studio Cloud for `labels`.",
);

has leaf => ( is  => "rw",
              isa => "Maybe[HashRef]|Chart::Plotly::Trace::Icicle::Leaf", );

has legendgrouptitle => ( is  => "rw",
                          isa => "Maybe[HashRef]|Chart::Plotly::Trace::Icicle::Legendgrouptitle", );

has legendrank => (
    is            => "rw",
    isa           => "Num",
    documentation =>
      "Sets the legend rank for this trace. Items and groups with smaller ranks are presented on top/left side while with `*reversed* `legend.traceorder` they are on bottom/right side. The default legendrank is 1000, so that you can use ranks less th...
);

has level => (
    is            => "rw",
    isa           => "Any",
lib/Chart/Plotly/Trace/Icicle.pm view on Meta::CPAN
has parentssrc => ( is => "rw",
isa => "Str",
documentation => "Sets the source reference on Chart Studio Cloud for `parents`.",
);
has pathbar => ( is => "rw",
isa => "Maybe[HashRef]|Chart::Plotly::Trace::Icicle::Pathbar", );
has root => ( is => "rw",
isa => "Maybe[HashRef]|Chart::Plotly::Trace::Icicle::Root", );
has sort => ( is => "rw",
isa => "Bool",
documentation => "Determines whether or not the sectors are reordered from largest to smallest.",
);
has stream => ( is => "rw",
isa => "Maybe[HashRef]|Chart::Plotly::Trace::Icicle::Stream", );
has text => (
is => "rw",
isa => "ArrayRef|PDL",
documentation =>
"Sets text elements associated with each sector. If trace `textinfo` contains a *text* flag, these elements will be seen on the chart. If trace `hoverinfo` contains a *text* flag and *hovertext* is not set, these elements will be seen in the ho...
);
has textfont => ( is => "rw",
isa => "Maybe[HashRef]|Chart::Plotly::Trace::Icicle::Textfont", );
has textinfo => ( is => "rw",
isa => "Str",
documentation => "Determines which trace information appear on the graph.",
);
has textposition => ( is => "rw",
isa => enum(
[ "top left",
"top center",
"top right",
"middle left",
"middle center",
"middle right",
"bottom left",
"bottom center",
"bottom right"
]
),
documentation => "Sets the positions of the `text` elements.",
);
has textsrc => ( is => "rw",
isa => "Str",
documentation => "Sets the source reference on Chart Studio Cloud for `text`.",
);
has texttemplate => (
is => "rw",
isa => "Str|ArrayRef[Str]",
documentation =>
"Template string used for rendering the information text that appear on points. Note that this will override `textinfo`. Variables are inserted using %{variable}, for example \"y: %{y}\". Numbers are formatted using d3-format's syntax %{variabl...
);
has texttemplatesrc => ( is => "rw",
isa => "Str",
documentation => "Sets the source reference on Chart Studio Cloud for `texttemplate`.",
);
has tiling => ( is => "rw",
isa => "Maybe[HashRef]|Chart::Plotly::Trace::Icicle::Tiling", );
has transforms => ( is => "rw",
isa => "ArrayRef|ArrayRef[Chart::Plotly::Trace::Icicle::Transform]", );
has uid => (
is => "rw",
isa => "Str",
documentation =>
"Assign an id to this trace, Use this to provide object constancy between traces during animations and transitions.",
);
has uirevision => (
is => "rw",
isa => "Any",
documentation =>
"Controls persistence of some user-driven changes to the trace: `constraintrange` in `parcoords` traces, as well as some `editable: true` modifications such as `name` and `colorbar.title`. Defaults to `layout.uirevision`. Note that other user-d...
);
has values => (
is => "rw",
isa => "ArrayRef|PDL",
documentation =>
"Sets the values associated with each of the sectors. Use with `branchvalues` to determine how the values are summed.",
);
has valuessrc => ( is => "rw",
isa => "Str",
documentation => "Sets the source reference on Chart Studio Cloud for `values`.",
);
has visible => (
is => "rw",
documentation =>
"Determines whether or not this trace is visible. If *legendonly*, the trace is not drawn, but can appear as a legend item (provided that the legend itself is visible).",
);
__PACKAGE__->meta->make_immutable();
1;
__END__
=pod
=encoding utf-8
=head1 NAME
Chart::Plotly::Trace::Icicle - Visualize hierarchal data from leaves (and/or outer branches) towards root with rectangles. The icicle sectors are determined by the entries in *labels* or *ids* and in *parents*.
=head1 VERSION
version 0.042
=head1 SYNOPSIS
use Chart::Plotly;
use Chart::Plotly::Plot;
use JSON;
use Chart::Plotly::Trace::Icicle;
# Example from https://github.com/plotly/plotly.js/blob/9a57346d35f28a7969beea9e0fc35e13932275c6/test/image/mocks/icicle_coffee.json
my $trace1 = Chart::Plotly::Trace::Icicle->new({'parents' => ['', '', 'Aromas', 'Aromas', 'Aromas', 'Tastes', 'Tastes', 'Tastes', 'Tastes', 'Aromas-Enzymatic', 'Aromas-Enzymatic', 'Aromas-Enzymatic', 'Aromas-Sugar Browning', 'Aromas-Sugar Browning',...
my $plot = Chart::Plotly::Plot->new(
traces => [$trace1, ],
layout =>
{'margin' => {'t' => 0, 'l' => 0, 'b' => 0, 'r' => 0, }, 'shapes' => [{'x0' => 0, 'y1' => 1, 'y0' => 0, 'x1' => 1, 'type' => 'rect', 'layer' => 'below', }, ], 'height' => 500, 'width' => 500, }
);
Chart::Plotly::show_plot($plot);
=head1 DESCRIPTION
Visualize hierarchal data from leaves (and/or outer branches) towards root with rectangles. The icicle sectors are determined by the entries in *labels* or *ids* and in *parents*.
Screenshot of the above example:
=for HTML <p>
<img src="https://raw.githubusercontent.com/pablrod/p5-Chart-Plotly/master/examples/traces/icicle.png" alt="Screenshot of the above example">
</p>
=for markdown 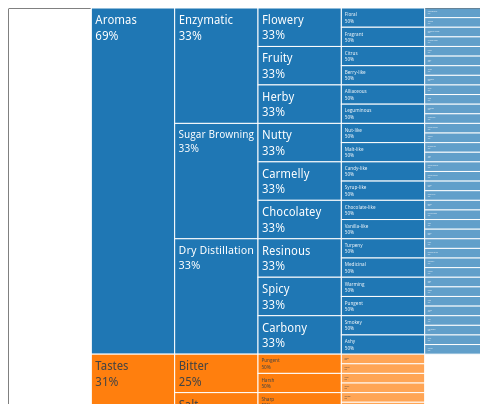
=for HTML <p>
<iframe src="https://raw.githubusercontent.com/pablrod/p5-Chart-Plotly/master/examples/traces/icicle.html" style="border:none;" width="80%" height="520"></iframe>
</p>
This file has been autogenerated from the official plotly.js source.
If you like Plotly, please support them: L<https://plot.ly/>
Open source announcement: L<https://plot.ly/javascript/open-source-announcement/>
Full reference: L<https://plot.ly/javascript/reference/#icicle>
=head1 DISCLAIMER
This is an unofficial Plotly Perl module. Currently I'm not affiliated in any way with Plotly.
But I think plotly.js is a great library and I want to use it with perl.
=head1 METHODS
=head2 TO_JSON
Serialize the trace to JSON. This method should be called only by L<JSON> serializer.
=head2 type
Trace type.
=head1 ATTRIBUTES
=over
=item * branchvalues
Determines how the items in `values` are summed. When set to *total*, items in `values` are taken to be value of all its descendants. When set to *remainder*, items in `values` corresponding to the root and the branches sectors are taken to be the ex...
=item * count
Determines default for `values` when it is not provided, by inferring a 1 for each of the *leaves* and/or *branches*, otherwise 0.
=item * customdata
Assigns extra data each datum. This may be useful when listening to hover, click and selection events. Note that, *scatter* traces also appends customdata items in the markers DOM elements
=item * customdatasrc
Sets the source reference on Chart Studio Cloud for `customdata`.
=item * domain
=item * hoverinfo
Determines which trace information appear on hover. If `none` or `skip` are set, no information is displayed upon hovering. But, if `none` is set, click and hover events are still fired.
=item * hoverinfosrc
Sets the source reference on Chart Studio Cloud for `hoverinfo`.
=item * hoverlabel
=item * hovertemplate
Template string used for rendering the information that appear on hover box. Note that this will override `hoverinfo`. Variables are inserted using %{variable}, for example "y: %{y}" as well as %{xother}, {%_xother}, {%_xother_}, {%xother_}. When sho...
=item * hovertemplatesrc
Sets the source reference on Chart Studio Cloud for `hovertemplate`.
=item * hovertext
Sets hover text elements associated with each sector. If a single string, the same string appears for all data points. If an array of string, the items are mapped in order of this trace's sectors. To be seen, trace `hoverinfo` must contain a *text* f...
=item * hovertextsrc
Sets the source reference on Chart Studio Cloud for `hovertext`.
=item * ids
Assigns id labels to each datum. These ids for object constancy of data points during animation. Should be an array of strings, not numbers or any other type.
=item * idssrc
Sets the source reference on Chart Studio Cloud for `ids`.
=item * insidetextfont
=item * labels
Sets the labels of each of the sectors.
=item * labelssrc
Sets the source reference on Chart Studio Cloud for `labels`.
=item * leaf
=item * legendgrouptitle
=item * legendrank
Sets the legend rank for this trace. Items and groups with smaller ranks are presented on top/left side while with `*reversed* `legend.traceorder` they are on bottom/right side. The default legendrank is 1000, so that you can use ranks less than 1000...
=item * level
Sets the level from which this trace hierarchy is rendered. Set `level` to `''` to start from the root node in the hierarchy. Must be an "id" if `ids` is filled in, otherwise plotly attempts to find a matching item in `labels`.
=item * marker
=item * maxdepth
Sets the number of rendered sectors from any given `level`. Set `maxdepth` to *-1* to render all the levels in the hierarchy.
=item * pmeta
Assigns extra meta information associated with this trace that can be used in various text attributes. Attributes such as trace `name`, graph, axis and colorbar `title.text`, annotation `text` `rangeselector`, `updatemenues` and `sliders` `label` tex...
=item * metasrc
Sets the source reference on Chart Studio Cloud for `meta`.
=item * name
Sets the trace name. The trace name appear as the legend item and on hover.
=item * opacity
Sets the opacity of the trace.
=item * outsidetextfont
=item * parents
Sets the parent sectors for each of the sectors. Empty string items '' are understood to reference the root node in the hierarchy. If `ids` is filled, `parents` items are understood to be "ids" themselves. When `ids` is not set, plotly attempts to fi...
=item * parentssrc
Sets the source reference on Chart Studio Cloud for `parents`.
=item * pathbar
=item * root
=item * sort
Determines whether or not the sectors are reordered from largest to smallest.
=item * stream
=item * text
Sets text elements associated with each sector. If trace `textinfo` contains a *text* flag, these elements will be seen on the chart. If trace `hoverinfo` contains a *text* flag and *hovertext* is not set, these elements will be seen in the hover lab...
=item * textfont
=item * textinfo
Determines which trace information appear on the graph.
=item * textposition
Sets the positions of the `text` elements.
=item * textsrc
Sets the source reference on Chart Studio Cloud for `text`.
=item * texttemplate
Template string used for rendering the information text that appear on points. Note that this will override `textinfo`. Variables are inserted using %{variable}, for example "y: %{y}". Numbers are formatted using d3-format's syntax %{variable:d3-form...
=item * texttemplatesrc
Sets the source reference on Chart Studio Cloud for `texttemplate`.
=item * tiling
=item * transforms
=item * uid
Assign an id to this trace, Use this to provide object constancy between traces during animations and transitions.
=item * uirevision
Controls persistence of some user-driven changes to the trace: `constraintrange` in `parcoords` traces, as well as some `editable: true` modifications such as `name` and `colorbar.title`. Defaults to `layout.uirevision`. Note that other user-driven t...
=item * values
Sets the values associated with each of the sectors. Use with `branchvalues` to determine how the values are summed.
=item * valuessrc
Sets the source reference on Chart Studio Cloud for `values`.
=item * visible
Determines whether or not this trace is visible. If *legendonly*, the trace is not drawn, but can appear as a legend item (provided that the legend itself is visible).
=back
=head1 AUTHOR
Pablo RodrÃguez González <pablo.rodriguez.gonzalez@gmail.com>
=head1 COPYRIGHT AND LICENSE
This software is Copyright (c) 2022 by Pablo RodrÃguez González.
This is free software, licensed under:
The MIT (X11) License
=cut
( run in 0.727 second using v1.01-cache-2.11-cpan-39bf76dae61 )