Chart-Plotly
view release on metacpan or search on metacpan
lib/Chart/Plotly/Trace/Histogram.pm view on Meta::CPAN
has textposition => (
is => "rw",
isa => enum( [ "inside", "outside", "auto", "none" ] ),
documentation =>
"Specifies the location of the `text`. *inside* positions `text` inside, next to the bar end (rotated and scaled if needed). *outside* positions `text` outside, next to the bar end (scaled if needed), unless there is another bar stacked on this...
);
has textsrc => ( is => "rw",
isa => "Str",
documentation => "Sets the source reference on Chart Studio Cloud for `text`.",
);
has texttemplate => (
is => "rw",
isa => "Str",
documentation =>
"Template string used for rendering the information text that appear on points. Note that this will override `textinfo`. Variables are inserted using %{variable}, for example \"y: %{y}\". Numbers are formatted using d3-format's syntax %{variabl...
);
has transforms => ( is => "rw",
isa => "ArrayRef|ArrayRef[Chart::Plotly::Trace::Histogram::Transform]", );
has uid => (
is => "rw",
isa => "Str",
documentation =>
"Assign an id to this trace, Use this to provide object constancy between traces during animations and transitions.",
);
has uirevision => (
is => "rw",
isa => "Any",
documentation =>
"Controls persistence of some user-driven changes to the trace: `constraintrange` in `parcoords` traces, as well as some `editable: true` modifications such as `name` and `colorbar.title`. Defaults to `layout.uirevision`. Note that other user-d...
);
has unselected => ( is => "rw",
isa => "Maybe[HashRef]|Chart::Plotly::Trace::Histogram::Unselected", );
has visible => (
is => "rw",
documentation =>
"Determines whether or not this trace is visible. If *legendonly*, the trace is not drawn, but can appear as a legend item (provided that the legend itself is visible).",
);
has x => ( is => "rw",
isa => "ArrayRef|PDL",
documentation => "Sets the sample data to be binned on the x axis.",
);
has xaxis => (
is => "rw",
documentation =>
"Sets a reference between this trace's x coordinates and a 2D cartesian x axis. If *x* (the default value), the x coordinates refer to `layout.xaxis`. If *x2*, the x coordinates refer to `layout.xaxis2`, and so on.",
);
has xbins => ( is => "rw",
isa => "Maybe[HashRef]|Chart::Plotly::Trace::Histogram::Xbins", );
has xcalendar => ( is => "rw",
isa => enum(
[ "chinese", "coptic", "discworld", "ethiopian", "gregorian", "hebrew", "islamic", "jalali",
"julian", "mayan", "nanakshahi", "nepali", "persian", "taiwan", "thai", "ummalqura"
]
),
documentation => "Sets the calendar system to use with `x` date data.",
);
has xhoverformat => (
is => "rw",
isa => "Str",
documentation =>
"Sets the hover text formatting rulefor `x` using d3 formatting mini-languages which are very similar to those in Python. For numbers, see: https://github.com/d3/d3-format/tree/v1.4.5#d3-format. And for dates see: https://github.com/d3/d3-time...
);
has xsrc => ( is => "rw",
isa => "Str",
documentation => "Sets the source reference on Chart Studio Cloud for `x`.",
);
has y => ( is => "rw",
isa => "ArrayRef|PDL",
documentation => "Sets the sample data to be binned on the y axis.",
);
has yaxis => (
is => "rw",
documentation =>
"Sets a reference between this trace's y coordinates and a 2D cartesian y axis. If *y* (the default value), the y coordinates refer to `layout.yaxis`. If *y2*, the y coordinates refer to `layout.yaxis2`, and so on.",
);
has ybins => ( is => "rw",
isa => "Maybe[HashRef]|Chart::Plotly::Trace::Histogram::Ybins", );
has ycalendar => ( is => "rw",
isa => enum(
[ "chinese", "coptic", "discworld", "ethiopian", "gregorian", "hebrew", "islamic", "jalali",
"julian", "mayan", "nanakshahi", "nepali", "persian", "taiwan", "thai", "ummalqura"
]
),
documentation => "Sets the calendar system to use with `y` date data.",
);
has yhoverformat => (
is => "rw",
isa => "Str",
documentation =>
"Sets the hover text formatting rulefor `y` using d3 formatting mini-languages which are very similar to those in Python. For numbers, see: https://github.com/d3/d3-format/tree/v1.4.5#d3-format. And for dates see: https://github.com/d3/d3-time...
);
has ysrc => ( is => "rw",
isa => "Str",
documentation => "Sets the source reference on Chart Studio Cloud for `y`.",
);
__PACKAGE__->meta->make_immutable();
1;
__END__
=pod
=encoding utf-8
=head1 NAME
Chart::Plotly::Trace::Histogram - The sample data from which statistics are computed is set in `x` for vertically spanning histograms and in `y` for horizontally spanning histograms. Binning options are set `xbins` and `ybins` respectively if no aggr...
=head1 VERSION
version 0.042
=head1 SYNOPSIS
use HTML::Show;
use Chart::Plotly;
use Chart::Plotly::Trace::Histogram;
my $histogram = Chart::Plotly::Trace::Histogram->new( x => [ map { int( 10 * rand() ) } ( 1 .. 500 ) ] );
HTML::Show::show( Chart::Plotly::render_full_html( data => [$histogram] ) );
=head1 DESCRIPTION
The sample data from which statistics are computed is set in `x` for vertically spanning histograms and in `y` for horizontally spanning histograms. Binning options are set `xbins` and `ybins` respectively if no aggregation data is provided.
Screenshot of the above example:
=for HTML <p>
<img src="https://raw.githubusercontent.com/pablrod/p5-Chart-Plotly/master/examples/traces/histogram.png" alt="Screenshot of the above example">
</p>
=for markdown 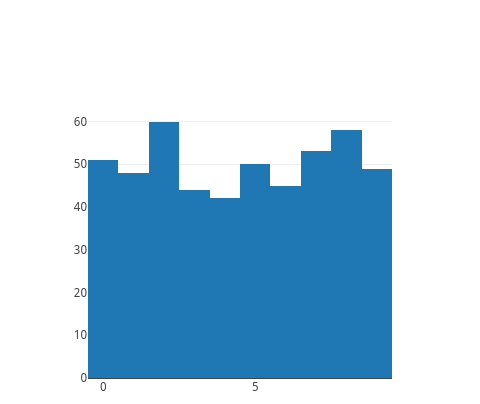
=for HTML <p>
<iframe src="https://raw.githubusercontent.com/pablrod/p5-Chart-Plotly/master/examples/traces/histogram.html" style="border:none;" width="80%" height="520"></iframe>
</p>
This file has been autogenerated from the official plotly.js source.
If you like Plotly, please support them: L<https://plot.ly/>
Open source announcement: L<https://plot.ly/javascript/open-source-announcement/>
lib/Chart/Plotly/Trace/Histogram.pm view on Meta::CPAN
=item * selected
=item * selectedpoints
Array containing integer indices of selected points. Has an effect only for traces that support selections. Note that an empty array means an empty selection where the `unselected` are turned on for all points, whereas, any other non-array values mea...
=item * showlegend
Determines whether or not an item corresponding to this trace is shown in the legend.
=item * stream
=item * text
Sets hover text elements associated with each bar. If a single string, the same string appears over all bars. If an array of string, the items are mapped in order to the this trace's coordinates.
=item * textangle
Sets the angle of the tick labels with respect to the bar. For example, a `tickangle` of -90 draws the tick labels vertically. With *auto* the texts may automatically be rotated to fit with the maximum size in bars.
=item * textfont
=item * textposition
Specifies the location of the `text`. *inside* positions `text` inside, next to the bar end (rotated and scaled if needed). *outside* positions `text` outside, next to the bar end (scaled if needed), unless there is another bar stacked on this one, t...
=item * textsrc
Sets the source reference on Chart Studio Cloud for `text`.
=item * texttemplate
Template string used for rendering the information text that appear on points. Note that this will override `textinfo`. Variables are inserted using %{variable}, for example "y: %{y}". Numbers are formatted using d3-format's syntax %{variable:d3-form...
=item * transforms
=item * uid
Assign an id to this trace, Use this to provide object constancy between traces during animations and transitions.
=item * uirevision
Controls persistence of some user-driven changes to the trace: `constraintrange` in `parcoords` traces, as well as some `editable: true` modifications such as `name` and `colorbar.title`. Defaults to `layout.uirevision`. Note that other user-driven t...
=item * unselected
=item * visible
Determines whether or not this trace is visible. If *legendonly*, the trace is not drawn, but can appear as a legend item (provided that the legend itself is visible).
=item * x
Sets the sample data to be binned on the x axis.
=item * xaxis
Sets a reference between this trace's x coordinates and a 2D cartesian x axis. If *x* (the default value), the x coordinates refer to `layout.xaxis`. If *x2*, the x coordinates refer to `layout.xaxis2`, and so on.
=item * xbins
=item * xcalendar
Sets the calendar system to use with `x` date data.
=item * xhoverformat
Sets the hover text formatting rulefor `x` using d3 formatting mini-languages which are very similar to those in Python. For numbers, see: https://github.com/d3/d3-format/tree/v1.4.5#d3-format. And for dates see: https://github.com/d3/d3-time-format...
=item * xsrc
Sets the source reference on Chart Studio Cloud for `x`.
=item * y
Sets the sample data to be binned on the y axis.
=item * yaxis
Sets a reference between this trace's y coordinates and a 2D cartesian y axis. If *y* (the default value), the y coordinates refer to `layout.yaxis`. If *y2*, the y coordinates refer to `layout.yaxis2`, and so on.
=item * ybins
=item * ycalendar
Sets the calendar system to use with `y` date data.
=item * yhoverformat
Sets the hover text formatting rulefor `y` using d3 formatting mini-languages which are very similar to those in Python. For numbers, see: https://github.com/d3/d3-format/tree/v1.4.5#d3-format. And for dates see: https://github.com/d3/d3-time-format...
=item * ysrc
Sets the source reference on Chart Studio Cloud for `y`.
=back
=head1 AUTHOR
Pablo RodrÃguez González <pablo.rodriguez.gonzalez@gmail.com>
=head1 COPYRIGHT AND LICENSE
This software is Copyright (c) 2022 by Pablo RodrÃguez González.
This is free software, licensed under:
The MIT (X11) License
=cut
( run in 1.036 second using v1.01-cache-2.11-cpan-f52f0507bed )