Chart-Plotly
view release on metacpan or search on metacpan
lib/Chart/Plotly/Trace/Funnel.pm view on Meta::CPAN
    isa           => "ArrayRef|PDL",
    documentation =>
      "Assigns id labels to each datum. These ids for object constancy of data points during animation. Should be an array of strings, not numbers or any other type.",
);

has idssrc => ( is            => "rw",
                isa           => "Str",
                documentation => "Sets the source reference on Chart Studio Cloud for `ids`.",
);

has insidetextanchor => (
         is            => "rw",
         isa           => enum( [ "end", "middle", "start" ] ),
         documentation => "Determines if texts are kept at center or start/end points in `textposition` *inside* mode.",
);

has insidetextfont => ( is  => "rw",
                        isa => "Maybe[HashRef]|Chart::Plotly::Trace::Funnel::Insidetextfont", );

has legendgroup => (
    is            => "rw",
    isa           => "Str",
    documentation =>
      "Sets the legend group for this trace. Traces part of the same legend group hide/show at the same time when toggling legend items.",
);

has legendgrouptitle => ( is  => "rw",
                          isa => "Maybe[HashRef]|Chart::Plotly::Trace::Funnel::Legendgrouptitle", );

has legendrank => (
    is            => "rw",
    isa           => "Num",
    documentation =>
      "Sets the legend rank for this trace. Items and groups with smaller ranks are presented on top/left side while with `*reversed* `legend.traceorder` they are on bottom/right side. The default legendrank is 1000, so that you can use ranks less th...
);

has marker => ( is  => "rw",
                isa => "Maybe[HashRef]|Chart::Plotly::Trace::Funnel::Marker", );

has pmeta => (
    is            => "rw",
    isa           => "Any|ArrayRef[Any]",
    documentation =>
      "Assigns extra meta information associated with this trace that can be used in various text attributes. Attributes such as trace `name`, graph, axis and colorbar `title.text`, annotation `text` `rangeselector`, `updatemenues` and `sliders` `lab...
);

has metasrc => ( is            => "rw",
                 isa           => "Str",
                 documentation => "Sets the source reference on Chart Studio Cloud for `meta`.",
);

has name => ( is            => "rw",
              isa           => "Str",
              documentation => "Sets the trace name. The trace name appear as the legend item and on hover.",
);

has offset => (
    is            => "rw",
    isa           => "Num",
    documentation =>
      "Shifts the position where the bar is drawn (in position axis units). In *group* barmode, traces that set *offset* will be excluded and drawn in *overlay* mode instead.",
);

has offsetgroup => (
    is            => "rw",
    isa           => "Str",
    documentation =>
      "Set several traces linked to the same position axis or matching axes to the same offsetgroup where bars of the same position coordinate will line up.",
);

has opacity => ( is            => "rw",
                 isa           => "Num",
                 documentation => "Sets the opacity of the trace.",
);

has orientation => (
    is            => "rw",
    isa           => enum( [ "v", "h" ] ),
    documentation =>
      "Sets the orientation of the funnels. With *v* (*h*), the value of the each bar spans along the vertical (horizontal). By default funnels are tend to be oriented horizontally; unless only *y* array is presented or orientation is set to *v*. Als...
);

has outsidetextfont => ( is  => "rw",
                         isa => "Maybe[HashRef]|Chart::Plotly::Trace::Funnel::Outsidetextfont", );

has selectedpoints => (
    is            => "rw",
    isa           => "Any",
    documentation =>
      "Array containing integer indices of selected points. Has an effect only for traces that support selections. Note that an empty array means an empty selection where the `unselected` are turned on for all points, whereas, any other non-array val...
);

has showlegend => (
               is            => "rw",
               isa           => "Bool",
               documentation => "Determines whether or not an item corresponding to this trace is shown in the legend.",
);

has stream => ( is  => "rw",
                isa => "Maybe[HashRef]|Chart::Plotly::Trace::Funnel::Stream", );

has text => (
    is            => "rw",
    isa           => "Str|ArrayRef[Str]",
    documentation =>
      "Sets text elements associated with each (x,y) pair. If a single string, the same string appears over all the data points. If an array of string, the items are mapped in order to the this trace's (x,y) coordinates. If trace `hoverinfo` contains...
);

has textangle => (
    is            => "rw",
    documentation =>
      "Sets the angle of the tick labels with respect to the bar. For example, a `tickangle` of -90 draws the tick labels vertically. With *auto* the texts may automatically be rotated to fit with the maximum size in bars.",
);

has textfont => ( is  => "rw",
                  isa => "Maybe[HashRef]|Chart::Plotly::Trace::Funnel::Textfont", );

has textinfo => (
    is            => "rw",
    isa           => "Str",
    documentation =>
lib/Chart/Plotly/Trace/Funnel.pm view on Meta::CPAN
isa => "Any",
documentation =>
"Only relevant when the axis `type` is *date*. Sets the period positioning in milliseconds or *n* on the y axis. Special values in the form of *n* could be used to declare the number of months. In this case `n` must be a positive integer.",
);
has yperiod0 => (
is => "rw",
isa => "Any",
documentation =>
"Only relevant when the axis `type` is *date*. Sets the base for period positioning in milliseconds or date string on the y0 axis. When `y0period` is round number of weeks, the `y0period0` by default would be on a Sunday i.e. 2000-01-02, otherw...
);
has yperiodalignment => (
is => "rw",
isa => enum( [ "start", "middle", "end" ] ),
documentation => "Only relevant when the axis `type` is *date*. Sets the alignment of data points on the y axis.",
);
has ysrc => ( is => "rw",
isa => "Str",
documentation => "Sets the source reference on Chart Studio Cloud for `y`.",
);
__PACKAGE__->meta->make_immutable();
1;
__END__
=pod
=encoding utf-8
=head1 NAME
Chart::Plotly::Trace::Funnel - Visualize stages in a process using length-encoded bars. This trace can be used to show data in either a part-to-whole representation wherein each item appears in a single stage, or in a "drop-off" representation wherei...
=head1 VERSION
version 0.042
=head1 SYNOPSIS
use Chart::Plotly;
use Chart::Plotly::Plot;
use JSON;
use Chart::Plotly::Trace::Funnel;
# Example from https://github.com/plotly/plotly.js/blob/b93e3a5a83b6561ac6258a59f274b5fc87630c3e/test/image/mocks/funnel_11.json
my $trace1 = Chart::Plotly::Trace::Funnel->new({'orientation' => 'v', 'marker' => {'color' => 'rgb(255, 102, 97)', }, 'y' => [13.23, 22.7, 26.06, ], 'x' => ['Half Dose', 'Full Dose', 'Double Dose', ], 'name' => 'Orange Juice', });
my $trace2 = Chart::Plotly::Trace::Funnel->new({'name' => 'Vitamin C', 'marker' => {'color' => 'rgb(0, 196, 200)', }, 'y' => [7.98, 16.77, 26.14, ], 'x' => ['Half Dose', 'Full Dose', 'Double Dose', ], 'orientation' => 'v', });
my $trace3 = Chart::Plotly::Trace::Funnel->new({'name' => 'Std Dev - OJ', 'x' => ['Half Dose', 'Full Dose', 'Double Dose', ], 'y' => [1.4102837, 1.236752, 0.8396031, ], 'visible' => JSON::false, 'orientation' => 'v', });
my $trace4 = Chart::Plotly::Trace::Funnel->new({'y' => [0.868562, 0.7954104, 1.5171757, ], 'x' => ['Half Dose', 'Full Dose', 'Double Dose', ], 'name' => 'Std Dev - VC', 'orientation' => 'v', 'visible' => JSON::false, });
my $plot = Chart::Plotly::Plot->new(
traces => [$trace1, $trace2, $trace3, $trace4, ],
layout =>
{'autosize' => JSON::false, 'hidesources' => JSON::false, 'plot_bgcolor' => 'rgb(217, 217, 217)', 'font' => {'color' => '#000', 'size' => 12, 'family' => 'Arial, sans-serif', }, 'width' => 600, 'separators' => '.,', 'legend' => {'xanchor' =>...
);
Chart::Plotly::show_plot($plot);
=head1 DESCRIPTION
Visualize stages in a process using length-encoded bars. This trace can be used to show data in either a part-to-whole representation wherein each item appears in a single stage, or in a "drop-off" representation wherein each item appears in each sta...
Screenshot of the above example:
=for HTML <p>
<img src="https://raw.githubusercontent.com/pablrod/p5-Chart-Plotly/master/examples/traces/funnel.png" alt="Screenshot of the above example">
</p>
=for markdown 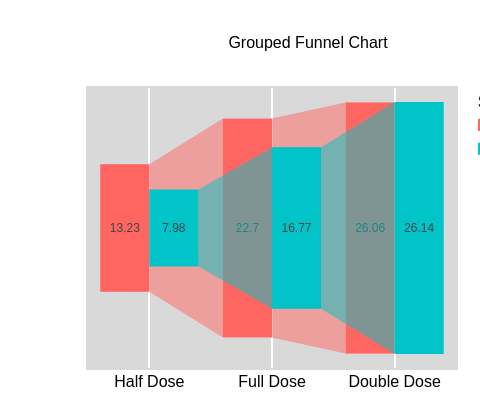
=for HTML <p>
<iframe src="https://raw.githubusercontent.com/pablrod/p5-Chart-Plotly/master/examples/traces/funnel.html" style="border:none;" width="80%" height="520"></iframe>
</p>
This file has been autogenerated from the official plotly.js source.
If you like Plotly, please support them: L<https://plot.ly/>
Open source announcement: L<https://plot.ly/javascript/open-source-announcement/>
Full reference: L<https://plot.ly/javascript/reference/#funnel>
=head1 DISCLAIMER
This is an unofficial Plotly Perl module. Currently I'm not affiliated in any way with Plotly.
But I think plotly.js is a great library and I want to use it with perl.
=head1 METHODS
=head2 TO_JSON
Serialize the trace to JSON. This method should be called only by L<JSON> serializer.
=head2 type
Trace type.
=head1 ATTRIBUTES
=over
=item * alignmentgroup
Set several traces linked to the same position axis or matching axes to the same alignmentgroup. This controls whether bars compute their positional range dependently or independently.
=item * cliponaxis
Determines whether the text nodes are clipped about the subplot axes. To show the text nodes above axis lines and tick labels, make sure to set `xaxis.layer` and `yaxis.layer` to *below traces*.
=item * connector
=item * constraintext
Constrain the size of text inside or outside a bar to be no larger than the bar itself.
lib/Chart/Plotly/Trace/Funnel.pm view on Meta::CPAN
Sets the source reference on Chart Studio Cloud for `hoverinfo`.

=item * hoverlabel

=item * hovertemplate

Template string used for rendering the information that appear on hover box. Note that this will override `hoverinfo`. Variables are inserted using %{variable}, for example "y: %{y}" as well as %{xother}, {%_xother}, {%_xother_}, {%xother_}. When sho...

=item * hovertemplatesrc

Sets the source reference on Chart Studio Cloud for `hovertemplate`.

=item * hovertext

Sets hover text elements associated with each (x,y) pair. If a single string, the same string appears over all the data points. If an array of string, the items are mapped in order to the this trace's (x,y) coordinates. To be seen, trace `hoverinfo` ...

=item * hovertextsrc

Sets the source reference on Chart Studio Cloud for `hovertext`.

=item * ids

Assigns id labels to each datum. These ids for object constancy of data points during animation. Should be an array of strings, not numbers or any other type.

=item * idssrc

Sets the source reference on Chart Studio Cloud for `ids`.

=item * insidetextanchor

Determines if texts are kept at center or start/end points in `textposition` *inside* mode.

=item * insidetextfont

=item * legendgroup

Sets the legend group for this trace. Traces part of the same legend group hide/show at the same time when toggling legend items.

=item * legendgrouptitle

=item * legendrank

Sets the legend rank for this trace. Items and groups with smaller ranks are presented on top/left side while with `*reversed* `legend.traceorder` they are on bottom/right side. The default legendrank is 1000, so that you can use ranks less than 1000...

=item * marker

=item * pmeta

Assigns extra meta information associated with this trace that can be used in various text attributes. Attributes such as trace `name`, graph, axis and colorbar `title.text`, annotation `text` `rangeselector`, `updatemenues` and `sliders` `label` tex...

=item * metasrc

Sets the source reference on Chart Studio Cloud for `meta`.

=item * name

Sets the trace name. The trace name appear as the legend item and on hover.

=item * offset

Shifts the position where the bar is drawn (in position axis units). In *group* barmode, traces that set *offset* will be excluded and drawn in *overlay* mode instead.

=item * offsetgroup

Set several traces linked to the same position axis or matching axes to the same offsetgroup where bars of the same position coordinate will line up.

=item * opacity

Sets the opacity of the trace.

=item * orientation

Sets the orientation of the funnels. With *v* (*h*), the value of the each bar spans along the vertical (horizontal). By default funnels are tend to be oriented horizontally; unless only *y* array is presented or orientation is set to *v*. Also regar...

=item * outsidetextfont

=item * selectedpoints

Array containing integer indices of selected points. Has an effect only for traces that support selections. Note that an empty array means an empty selection where the `unselected` are turned on for all points, whereas, any other non-array values mea...

=item * showlegend

Determines whether or not an item corresponding to this trace is shown in the legend.

=item * stream

=item * text

Sets text elements associated with each (x,y) pair. If a single string, the same string appears over all the data points. If an array of string, the items are mapped in order to the this trace's (x,y) coordinates. If trace `hoverinfo` contains a *tex...

=item * textangle

Sets the angle of the tick labels with respect to the bar. For example, a `tickangle` of -90 draws the tick labels vertically. With *auto* the texts may automatically be rotated to fit with the maximum size in bars.

=item * textfont

=item * textinfo

Determines which trace information appear on the graph. In the case of having multiple funnels, percentages & totals are computed separately (per trace).

=item * textposition

Specifies the location of the `text`. *inside* positions `text` inside, next to the bar end (rotated and scaled if needed). *outside* positions `text` outside, next to the bar end (scaled if needed), unless there is another bar stacked on this one, t...

=item * textpositionsrc

Sets the source reference on Chart Studio Cloud for `textposition`.

=item * textsrc

Sets the source reference on Chart Studio Cloud for `text`.

=item * texttemplate

Template string used for rendering the information text that appear on points. Note that this will override `textinfo`. Variables are inserted using %{variable}, for example "y: %{y}". Numbers are formatted using d3-format's syntax %{variable:d3-form...

=item * texttemplatesrc

Sets the source reference on Chart Studio Cloud for `texttemplate`.

=item * transforms
( run in 1.012 second using v1.01-cache-2.11-cpan-600a1bdf6e4 )