Chart-Plotly
view release on metacpan or search on metacpan
lib/Chart/Plotly/Trace/Barpolar.pm view on Meta::CPAN
package Chart::Plotly::Trace::Barpolar;
use Moose;
use MooseX::ExtraArgs;
use Moose::Util::TypeConstraints qw(enum union);
if ( !defined Moose::Util::TypeConstraints::find_type_constraint('PDL') ) {
    Moose::Util::TypeConstraints::type('PDL');
}

use Chart::Plotly::Trace::Barpolar::Hoverlabel;
use Chart::Plotly::Trace::Barpolar::Legendgrouptitle;
use Chart::Plotly::Trace::Barpolar::Marker;
use Chart::Plotly::Trace::Barpolar::Selected;
use Chart::Plotly::Trace::Barpolar::Stream;
use Chart::Plotly::Trace::Barpolar::Transform;
use Chart::Plotly::Trace::Barpolar::Unselected;

our $VERSION = '0.042';    # VERSION

# ABSTRACT: The data visualized by the radial span of the bars is set in `r`

sub TO_JSON {
    my $self       = shift;
    my $extra_args = $self->extra_args // {};
    my $meta       = $self->meta;
    my %hash       = %$self;
    for my $name ( sort keys %hash ) {
        my $attr = $meta->get_attribute($name);
        if ( defined $attr ) {
            my $value = $hash{$name};
            my $type  = $attr->type_constraint;
            if ( $type && $type->equals('Bool') ) {
                $hash{$name} = $value ? \1 : \0;
            }
        }
    }
    my $plotly_meta = delete $hash{'pmeta'};
    if ( defined $plotly_meta ) {
        $hash{'meta'} = $plotly_meta;
    }
    %hash = ( %hash, %$extra_args );
    delete $hash{'extra_args'};
    if ( $self->can('type') && ( !defined $hash{'type'} ) ) {
        $hash{type} = $self->type();
    }
    return \%hash;
}

sub type {
    my @components = split( /::/, __PACKAGE__ );
    return lc( $components[-1] );
}

has base => (
    is            => "rw",
    isa           => "Any|ArrayRef[Any]",
    documentation =>
      "Sets where the bar base is drawn (in radial axis units). In *stack* barmode, traces that set *base* will be excluded and drawn in *overlay* mode instead.",
);

has basesrc => ( is            => "rw",
                 isa           => "Str",
                 documentation => "Sets the source reference on Chart Studio Cloud for `base`.",
);

has customdata => (
    is            => "rw",
    isa           => "ArrayRef|PDL",
    documentation =>
      "Assigns extra data each datum. This may be useful when listening to hover, click and selection events. Note that, *scatter* traces also appends customdata items in the markers DOM elements",
);

has customdatasrc => ( is            => "rw",
                       isa           => "Str",
                       documentation => "Sets the source reference on Chart Studio Cloud for `customdata`.",
);

has dr => ( is            => "rw",
            isa           => "Num",
            documentation => "Sets the r coordinate step.",
);

has dtheta => (
    is            => "rw",
    isa           => "Num",
    documentation =>
      "Sets the theta coordinate step. By default, the `dtheta` step equals the subplot's period divided by the length of the `r` coordinates.",
);

has hoverinfo => (
    is            => "rw",
    isa           => "Str|ArrayRef[Str]",
    documentation =>
      "Determines which trace information appear on hover. If `none` or `skip` are set, no information is displayed upon hovering. But, if `none` is set, click and hover events are still fired.",
);

has hoverinfosrc => ( is            => "rw",
                      isa           => "Str",
                      documentation => "Sets the source reference on Chart Studio Cloud for `hoverinfo`.",
);

has hoverlabel => ( is  => "rw",
                    isa => "Maybe[HashRef]|Chart::Plotly::Trace::Barpolar::Hoverlabel", );

has hovertemplate => (
    is            => "rw",
    isa           => "Str|ArrayRef[Str]",
    documentation =>
      "Template string used for rendering the information that appear on hover box. Note that this will override `hoverinfo`. Variables are inserted using %{variable}, for example \"y: %{y}\" as well as %{xother}, {%_xother}, {%_xother_}, {%xother_}....
);

has hovertemplatesrc => ( is            => "rw",
                          isa           => "Str",
                          documentation => "Sets the source reference on Chart Studio Cloud for `hovertemplate`.",
);

has hovertext => ( is            => "rw",
                   isa           => "Str|ArrayRef[Str]",
lib/Chart/Plotly/Trace/Barpolar.pm view on Meta::CPAN
__END__
=pod
=encoding utf-8
=head1 NAME
Chart::Plotly::Trace::Barpolar - The data visualized by the radial span of the bars is set in `r`
=head1 VERSION
version 0.042
=head1 SYNOPSIS
use Chart::Plotly;
use Chart::Plotly::Trace::Barpolar;
use Chart::Plotly::Plot;
# Example from https://github.com/plotly/plotly.js/blob/235fe5b214a576d5749ab4c2aaf625dbf7138d63/test/image/mocks/polar_wind-rose.json
my $trace1 = Chart::Plotly::Trace::Barpolar->new(
r => [ 77.5, 72.5, 70.0, 45.0, 22.5, 42.5, 40.0, 62.5 ],
t => [ 'North', 'N-E', 'East', 'S-E', 'South', 'S-W', 'West', 'N-W' ],
name => '11-14 m/s',
marker => { color => 'rgb(106,81,163)' },
);
my $trace2 = {
r => [ 57.5, 50.0, 45.0, 35.0, 20.0, 22.5, 37.5, 55.0 ],
t => [ 'North', 'N-E', 'East', 'S-E', 'South', 'S-W', 'West', 'N-W' ],
name => '8-11 m/s',
marker => { color => 'rgb(158,154,200)' },
type => 'barpolar'
};
my $trace3 = {
r => [ 40.0, 30.0, 30.0, 35.0, 7.5, 7.5, 32.5, 40.0 ],
t => [ 'North', 'N-E', 'East', 'S-E', 'South', 'S-W', 'West', 'N-W' ],
name => '5-8 m/s',
marker => { color => 'rgb(203,201,226)' },
type => 'barpolar'
};
my $trace4 = {
r => [ 20.0, 7.5, 15.0, 22.5, 2.5, 2.5, 12.5, 22.5 ],
t => [ 'North', 'N-E', 'East', 'S-E', 'South', 'S-W', 'West', 'N-W' ],
name => '< 5 m/s',
marker => { color => 'rgb(242,240,247)' },
type => 'barpolar'
};
my $plot = Chart::Plotly::Plot->new(
traces => [ $trace1, $trace2, $trace3, $trace4 ],
layout => {
title => 'Wind Speed Distribution in Laurel, NE',
font => { size => 16 },
legend => { font => { size => 16 } },
polar => {
radialaxis => { ticksuffix => '%', angle => 45, dtick => 20 },
barmode => "overlay",
angularaxis => { direction => "clockwise" },
bargap => 0
}
}
);
Chart::Plotly::show_plot($plot);
=head1 DESCRIPTION
The data visualized by the radial span of the bars is set in `r`
Screenshot of the above example:
=for HTML <p>
<img src="https://raw.githubusercontent.com/pablrod/p5-Chart-Plotly/master/examples/traces/barpolar.png" alt="Screenshot of the above example">
</p>
=for markdown 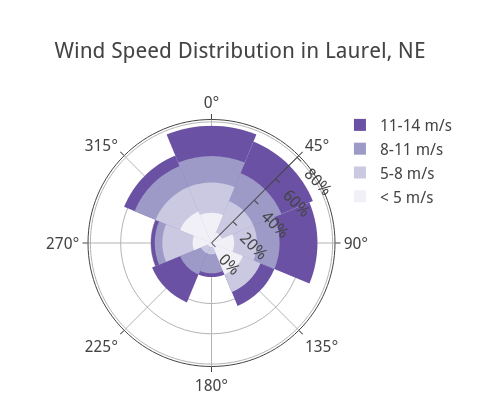
=for HTML <p>
<iframe src="https://raw.githubusercontent.com/pablrod/p5-Chart-Plotly/master/examples/traces/barpolar.html" style="border:none;" width="80%" height="520"></iframe>
</p>
This file has been autogenerated from the official plotly.js source.
If you like Plotly, please support them: L<https://plot.ly/>
Open source announcement: L<https://plot.ly/javascript/open-source-announcement/>
Full reference: L<https://plot.ly/javascript/reference/#barpolar>
=head1 DISCLAIMER
This is an unofficial Plotly Perl module. Currently I'm not affiliated in any way with Plotly.
But I think plotly.js is a great library and I want to use it with perl.
=head1 METHODS
=head2 TO_JSON
Serialize the trace to JSON. This method should be called only by L<JSON> serializer.
=head2 type
Trace type.
=head1 ATTRIBUTES
=over
=item * base
Sets where the bar base is drawn (in radial axis units). In *stack* barmode, traces that set *base* will be excluded and drawn in *overlay* mode instead.
=item * basesrc
Sets the source reference on Chart Studio Cloud for `base`.
=item * customdata
Assigns extra data each datum. This may be useful when listening to hover, click and selection events. Note that, *scatter* traces also appends customdata items in the markers DOM elements
=item * customdatasrc
Sets the source reference on Chart Studio Cloud for `customdata`.
=item * dr
Sets the r coordinate step.
=item * dtheta
Sets the theta coordinate step. By default, the `dtheta` step equals the subplot's period divided by the length of the `r` coordinates.
=item * hoverinfo
Determines which trace information appear on hover. If `none` or `skip` are set, no information is displayed upon hovering. But, if `none` is set, click and hover events are still fired.
=item * hoverinfosrc
Sets the source reference on Chart Studio Cloud for `hoverinfo`.
=item * hoverlabel
=item * hovertemplate
Template string used for rendering the information that appear on hover box. Note that this will override `hoverinfo`. Variables are inserted using %{variable}, for example "y: %{y}" as well as %{xother}, {%_xother}, {%_xother_}, {%xother_}. When sho...
=item * hovertemplatesrc
Sets the source reference on Chart Studio Cloud for `hovertemplate`.
=item * hovertext
Same as `text`.
=item * hovertextsrc
Sets the source reference on Chart Studio Cloud for `hovertext`.
=item * ids
Assigns id labels to each datum. These ids for object constancy of data points during animation. Should be an array of strings, not numbers or any other type.
=item * idssrc
Sets the source reference on Chart Studio Cloud for `ids`.
=item * legendgroup
Sets the legend group for this trace. Traces part of the same legend group hide/show at the same time when toggling legend items.
=item * legendgrouptitle
( run in 0.738 second using v1.01-cache-2.11-cpan-600a1bdf6e4 )